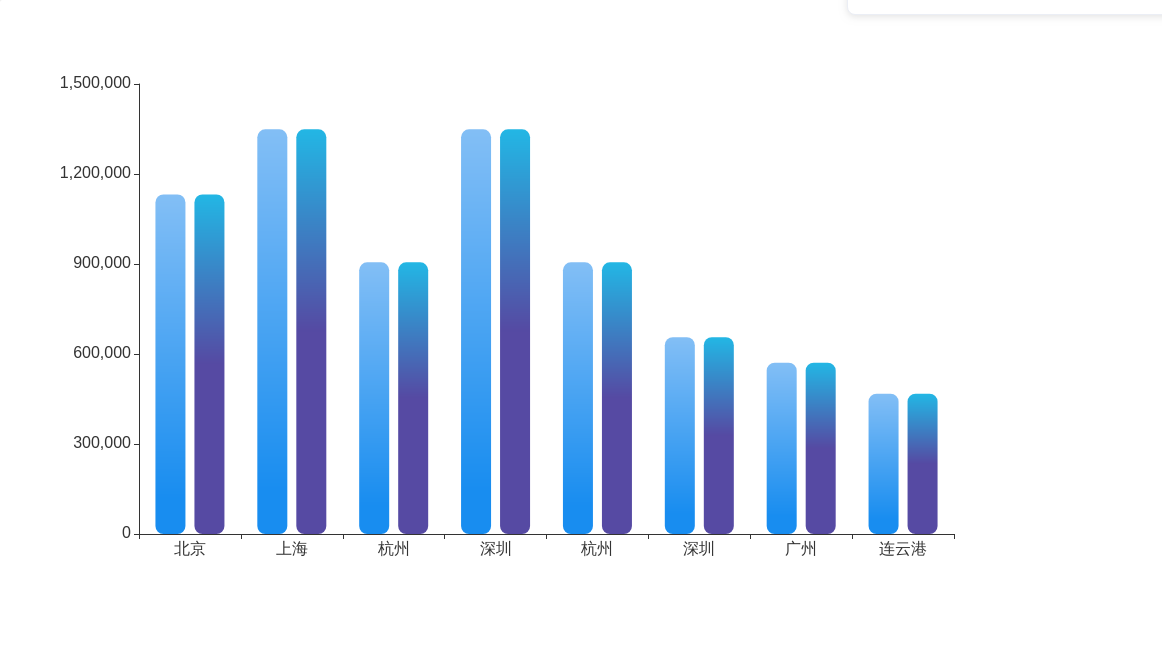
- EchartBar 柱形图
EchartBar 柱形图
TIP
1.1.0+
<!-- 导入需要的包 --><script src="https://cdnjs.cloudflare.com/ajax/libs/echarts/4.2.1/echarts.min.js"></script>

<avue-echart-bar ref="echart" :option="config" :data="data" width="1000"></avue-echart-bar><script>export default {data() {return {data: {"categories": ["北京","上海","杭州","深圳","杭州","深圳","广州","连云港"],"series": [{"name": "手机品牌","data": [1131776,1349011,905718,1349011,905718,656020,571234,467397]}, {"name": "其他手机品牌","data": [1131776,1349011,905718,1349011,905718,656020,571234,467397]}]},config: {refreshTime: 5000,title: '2019年度潍坊城市销售额排名',titlePostion: '',titleFontSize: 24,titleColor: 'rgb(115, 170, 229)',titleLink: "http://avue.top",info: '这是图表的简介',gridX: 105,gridY: 50,gridX2: 80,gridY2: 100,nameColor: '#333',lineColor: '#333',xNameFontSize: 16,yNameFontSize: 16,labelShow: false,labelShowFontSize: 14,labelShowFontWeight: 300,yAxisInverse: false,xAxisInverse: false,xAxisShow: true,yAxisShow: true,xAxisSplitLineShow: false,yAxisSplitLineShow: false,refresh: 3000,barWidth: 30,barRadius: 8,barColor: [{color1: '#83bff6',color2: '#188df0',postion: 90}, {color1: '#23B7E5',color2: '#564AA3',postion: 50}],barMinHeight: 2,}}},}</script>
